
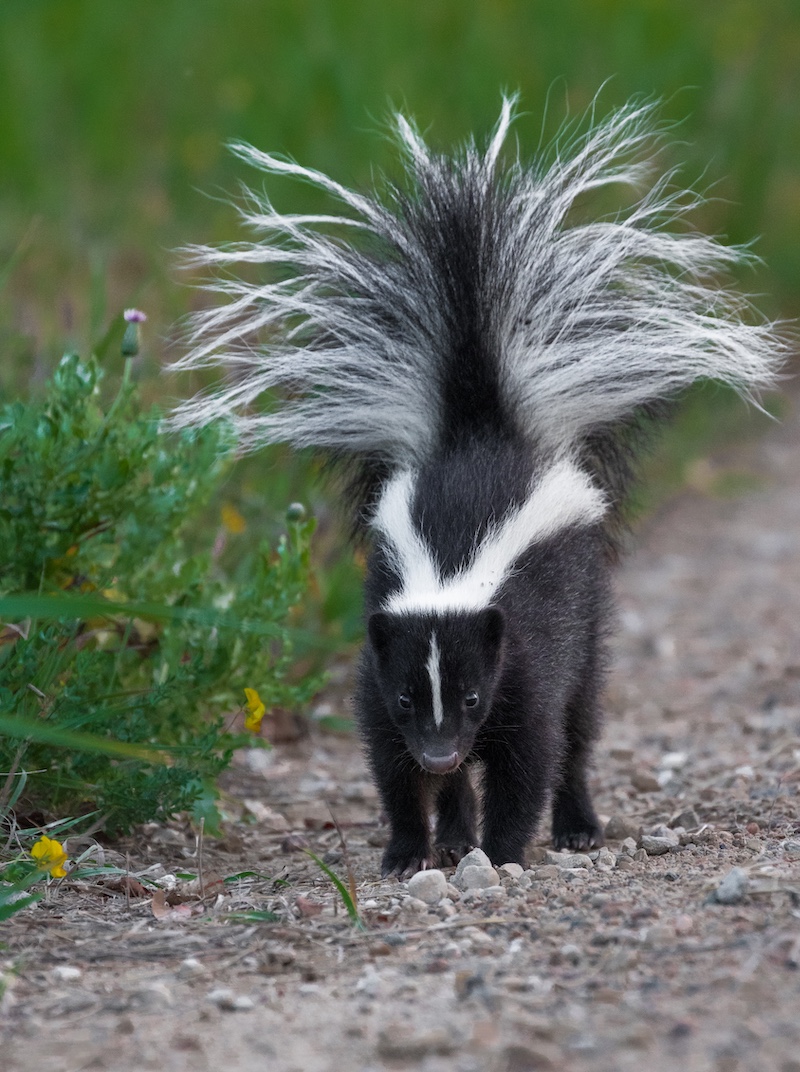
Photo by Mike Budd, USFWS.

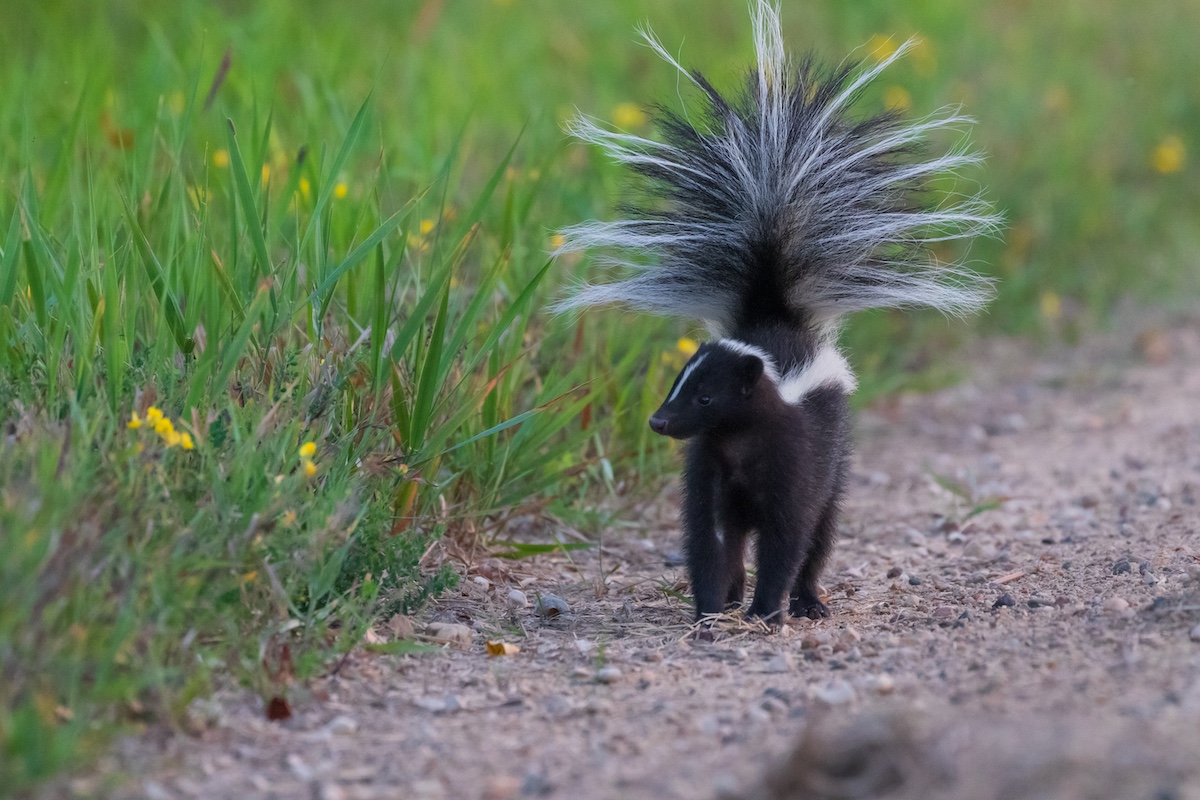
Photo by Mike Budd, USFWS.
If you’ve ever driven a backroad on a summer night and caught that unmistakable whiff of a striped skunk, you know they’re out there. But for wildlife managers, the real question isn’t whether skunks are around, it is: How many are out there? Where are they thriving? And are their numbers going up or down?
Long-term population monitoring is one of the cornerstones of wildlife management. Without it, managers are essentially flying blind. They need reliable data to decide how many animals can be harvested, when to adjust regulations, and whether species are stable or at risk. Yet tracking populations isn’t as simple as counting animals.
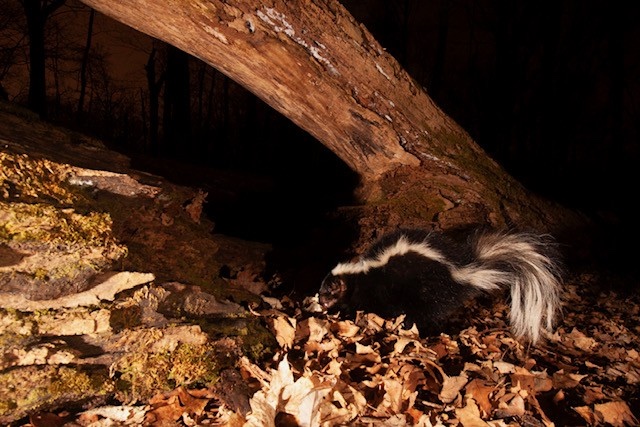
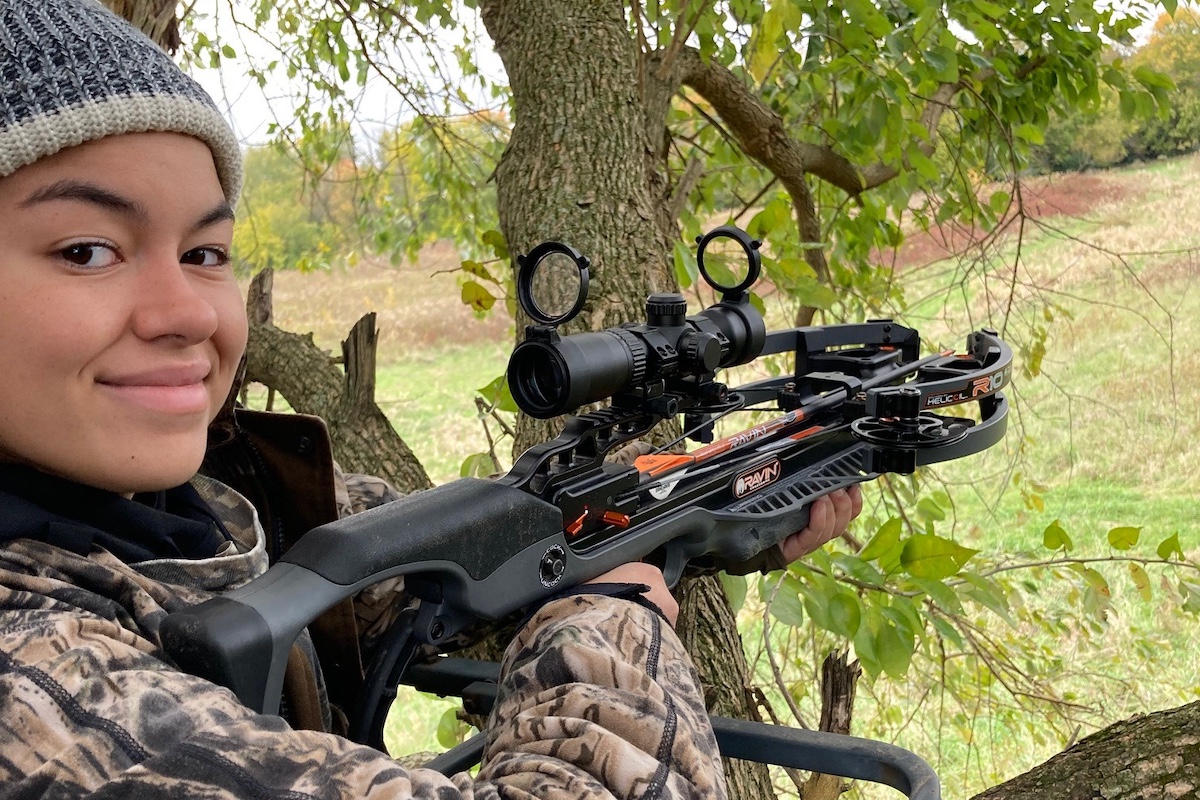
For furbearers, such as the striped skunk, the Illinois Department of Natural Resources (IDNR) relies on multiple sources of information. Archery hunters report sightings of skunks during deer season. Trappers turn in records of their harvest. Biologists conduct spotlight surveys at night, shining beams across fields and forest edges, as well as count roadkill to provide another glimpse into population trends. Each of these surveys captures part of the picture. But here’s the catch: they don’t always agree.
One method might suggest a population is on the rise while another shows a stable population. When managers try to interpret those results, the story can feel like trying to complete a puzzle using pieces from multiple sets.
That’s the challenge the INDR and researchers at the Illinois Natural History Survey (INHS) set out to solve.
“We wanted to know whether combining the data from multiple long-term monitoring programs could provide a more accurate and reliable picture of how skunk populations are changing across Illinois” said lead investigator Dr. Lauren Scopel.
At first glance, counting animals might seem straightforward. But in practice, it’s anything but. Populations are constantly changing as births, deaths, immigration, and emigration occur throughout the year, while habitat quality, food availability, weather and disease can all influence how many animals occupy an area. Furthermore, many species, including striped skunks, are primarily nocturnal and spend much of their lives hidden from view. Even when they are observed, individuals are difficult to distinguish from one another so estimating the true size of a wildlife population requires intensive field studies often involving multiple surveys or capture, marking, or other specialized techniques that demand substantial time, effort and money. Even then, the resulting estimates carry high levels of uncertainty.
As a result, many surveys rely on what biologists call abundance indices, measures that reflect relative changes in populations but don’t tell us the exact number of animals. But there’s a problem, abundance indices can be influenced by many things not directly related to the true population size. Skunks may remain hidden in dense vegetation that changes over time, alter their activity patterns in response to weather, or simply move outside a survey route because of habitat changes such as new housing developments. In each case, they can go undetected despite still being present in the landscape. Human factors complicate things further. Trapper harvests may rise or fall with changes in gas or fur prices, instead of population size. Roadkill counts can reflect traffic volume, weather, or road design as much as actual skunk abundance.
All of these muddy the waters in our understanding of actual abundance. One dataset might show an apparent increase that’s really just better detection. Another might suggest decline because of unrelated human or environmental factors. Fortunately, wildlife biologists have developed increasingly sophisticated analytical tools that help disentangle these signals and provide a clearer picture of how populations are truly changing.
In the case of the striped skunk IDNR and INHS biologists integrated data using a statistical approach called Bayesian state-space modeling. While that may sound technical, the idea is a lot like piecing together a jigsaw puzzle. Each survey, spotlight counts, trapper harvests, hunter observations, or roadkill tallies, is like holding just a handful of puzzle pieces. On their own, they show part of the picture, but with big gaps and sometimes misleading edges. One set of pieces might suggest the puzzle shows a forest. Another might hint at a river. It’s only when you fit the pieces together that the true image comes into focus. By combining surveys, the “missing pieces” are filled in, and the confusing or contradictory parts make more sense. That’s what integrated modeling does for wildlife data: it takes partial, noisy information from different sources and assembles them into a clearer, more reliable picture of how populations are really changing over time.
That’s essentially what the models do. They separate the “signal” (changes in skunk populations) from the “noise” (errors, biases and randomness). By using a Bayesian framework, the models incorporate uncertainty, which gives managers not just an estimate but a measure of how confident they can be in the estimate.
IDNR and INHS biologists applied this approach to four decades of Illinois skunk data, collected between 1979 and 2023. They used spotlight surveys (nighttime drives along designated routes while shining lights across fields), archery deer hunter observations (records of wildlife seen during hunting season), trapper harvest reports (the number of skunks caught each year) and roadkill counts (tallies of skunks hit by vehicles). They analyzed each survey on its own, then built an integrated model that combined all four datasets.
When they looked at the surveys individually, the story was messy. Trapping data suggested skunk numbers were increasing. Roadkill data told the opposite story, pointing to decline. Spotlight and hunter observations fell somewhere in between.
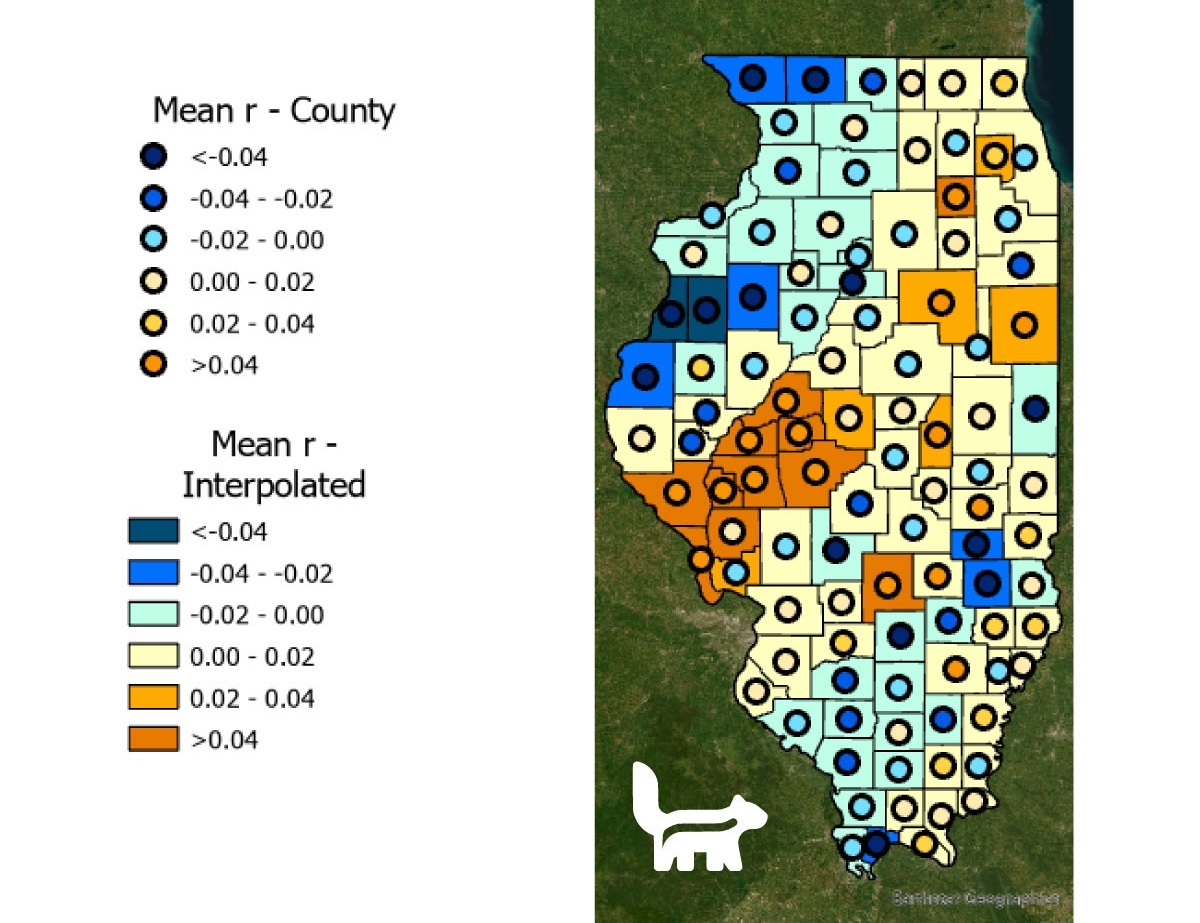
But once they combined the datasets, the picture became clearer. The integrated model showed that Illinois skunks have remained relatively stable over the long term, with some ups and downs but no dramatic crash. There are some areas where the population may growing, such as along the Illinois River Valley, and others where they are declining.
“These results demonstrate the value of integrating multiple sources of information,” said Dr Scopel. She added “This study shows how the spotlight survey sometimes is not very good at counting some species, including skunks. That’s a pretty powerful conclusion; just because you design a really good survey, it doesn’t mean that it is going to work well for all the species that you’re attempting to survey.” While local populations may fluctuate over time, the integrated analysis suggests that striped skunks have remained broadly stable across much of Illinois during the past four decades.
Just as importantly, the integrated model was much more precise than any single survey. On their own, some surveys would need 20–40 years to reliably detect small changes in population growth. The integrated model could pick up the same shifts in as little as 10 years. That’s a big deal for managers who need to respond to emerging threats like disease outbreaks, habitat loss, or shifts in harvest pressure.
These findings highlight a crucial lesson: no single survey can be trusted to tell the whole story. Each carries its own blind spots and biases. But when combined, they create a stronger, more reliable picture.
For harvested species like skunks, raccoons, or coyotes, accurate population estimates are especially important. Harvest regulations are designed to balance ecological sustainability with cultural and economic traditions. Overestimating a population could lead to overharvest and decline. Underestimating could unnecessarily restrict opportunities for hunters and trappers. Either way, mistakes can erode trust between the public and management agencies.
Integrated models don’t replace traditional surveys or eliminate the need for absolute abundance estimates (which require more intensive fieldwork). But they provide a powerful tool to reduce uncertainty and improve decision-making. By detecting real population changes sooner and more reliably, they help managers act before problems become crises.
The challenges we face with skunks are often the same across the wildlife management world. Citizen science projects, for example, are providing huge volumes of new data. But these datasets often come with biases, they may be collected opportunistically, concentrated around neighborhoods in cities, or inconsistent in effort. Traditional surveys have their own weaknesses, too.
Because of this, the future of wildlife monitoring may lie in integration. By borrowing strength from multiple sources, managers can gain sharper insights, even from imperfect data. This approach won’t replace careful fieldwork, but it can stretch the value of existing surveys and ensure that long-term trends are interpreted correctly.
For Illinois skunks, the message is reassuring: populations appear stable overall, despite some local ups and downs. But the bigger lesson is that wildlife monitoring is as much about combining evidence as it is about collecting it. Although every dataset has limitations, modern analytical tools allow IDNR biologists to extract meaningful insights and make sound management decisions with confidence.
The next time you catch a whiff of skunk drifting through the night air, you’ll know there’s more to the story than meets the nose. Behind the scenes, scientists and managers are working hard to understand not just whether skunks are there, but how their populations are changing, and what that means for the future of Illinois’s landscapes and communities.
Kirk Stodola is an Assistant Population Ecologist at the Illinois Natural History Survey. He received his Ph.D. from the University of Georgia and currently works on applied conservation and management issues with a variety of taxa in the state of Illinois.
Kathan Bandyopadhyay is a Postdoctoral Research Associate at the Illinois Natural History Survey, working in Max Allen’s lab on statewide furbearer ecology and population dynamics in Illinois. He recently completed his Ph.D. in Zoology and Physiology at the University of Wyoming where his research focused on the ecology, distribution and coexistence of meso-carnivores in human-dominated landscapes of India. His work broadly centers on carnivore ecology and conservation, with a particular emphasis on how species, especially small wild cats native to India, persist and interact within multi-use landscapes shaped by human activity. His research integrates camera trapping, spatial capture–recapture, occupancy modeling, and habitat suitability approaches to understand species distributions, density and niche partitioning across ecological gradients. Prior to his doctoral work, Bandyopadhyay completed his M.Sc. in Wildlife Management and Conservation at the University of Reading. He has extensive field and analytical experience across India, UK and Namibia, including work with the Wildlife Institute of India and the Cheetah Conservation Fund, where he studied predator–prey dynamics, large carnivore populations, and conservation strategies for species such as cheetahs and leopards and other lesser-known carnivores. In his current role, he combines large-scale datasets from camera traps, GPS telemetry, and community science to model the distribution, movement, and habitat use of furbearers, contributing to applied wildlife management and conservation planning.





Submit a question for the author